Efficacy assessment of TCE

More reliable efficacy readouts with pre-clinical models built for T-cell engager biology

Ready to Move Beyond the Limitations of Your TCE Model for Efficacy Studies?

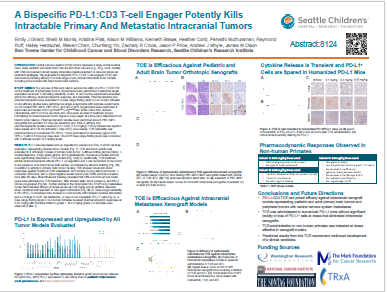
Testing T cell engagers (TCEs) for immuno-oncology can be difficult when preclinical models fail to reflect human target expression, T cell activation, and tumor immune evasion mechanisms such as inhibitory checkpoints and immunosuppressive cells. Oversimplified mouse models, surrogate constructs, and PBMC reconstituted systems often overestimate efficacy and fail to predict clinical behavior.

Which Pre-Clinical Model is Right for Your TCE Efficacy Testing?

Whether you're developing bispecifics, trispecifics, Fc engineered molecules, or costimulatory CD28-based TCEs, genOway provides human relevant mouse models validated with biopharma partners and TAA-expressing cell lines that help you generate more predictive efficacy data:

hCD3 models:

genOway’s portfolio of hCD3 models has been used by biopharma companies like AstraZeneca and Pfizer to reliably assess their T-cell engagers. This is thanks to the following features:

  • Physiological human CD3 expression
  • Unaltered CD3/TCR interactions
  • Functional T/B cell cooperation and immune homeostasis

These features ensure your TCE engages its target like it would in humans, delivering more reliable efficacy predictions.

Examples of pharmaceutical companies that have used genOway’s hCD3 models

  • Pfizer evaluated PF07260437, a B7-H4×CD3 bispecific that redirects T cells to kill B7-H4+ breast cancer cells, using the genO-hCD3ε model
Graph of tumor volume over time showing improved tumor growth inhibition with combined PF‑07260437 and anti‑PD‑1 treatment compared with vehicle or single agents.
Figure 1 – Tumor growth inhibition of E0771 cells expressing B7-H4 implanted in genO-hCD3ε mice. Mice were treated with PF-07260437 alone, or in combination with a murine anti-PD-1. Treatment with the TCE alone or in combination leads to efficient tumor growth inhibition. Adapted from Abayasiriwardana et al., 2025.

  • AstraZeneca tested AZD5863, a CLDN18.2-targeting TCE with reduced CD3 affinity to limit cytokine release, using the genO-panhCD3 model. This molecule is now in clinical trials.
Graph of tumor volume over time showing dose‑dependent tumor growth inhibition with AZD5863 compared with isotype control, indicating reduced tumor growth at higher doses.
Figure 2 – Tumor growth inhibition of MC38 cells expressing CLDN18.2 implanted in genO-panhCD3 mice. Mice were treated with different doses of AZD5863. Treatment with the TCE leads to efficient tumor growth inhibition. Adapted from Gaspar et al., 2025.

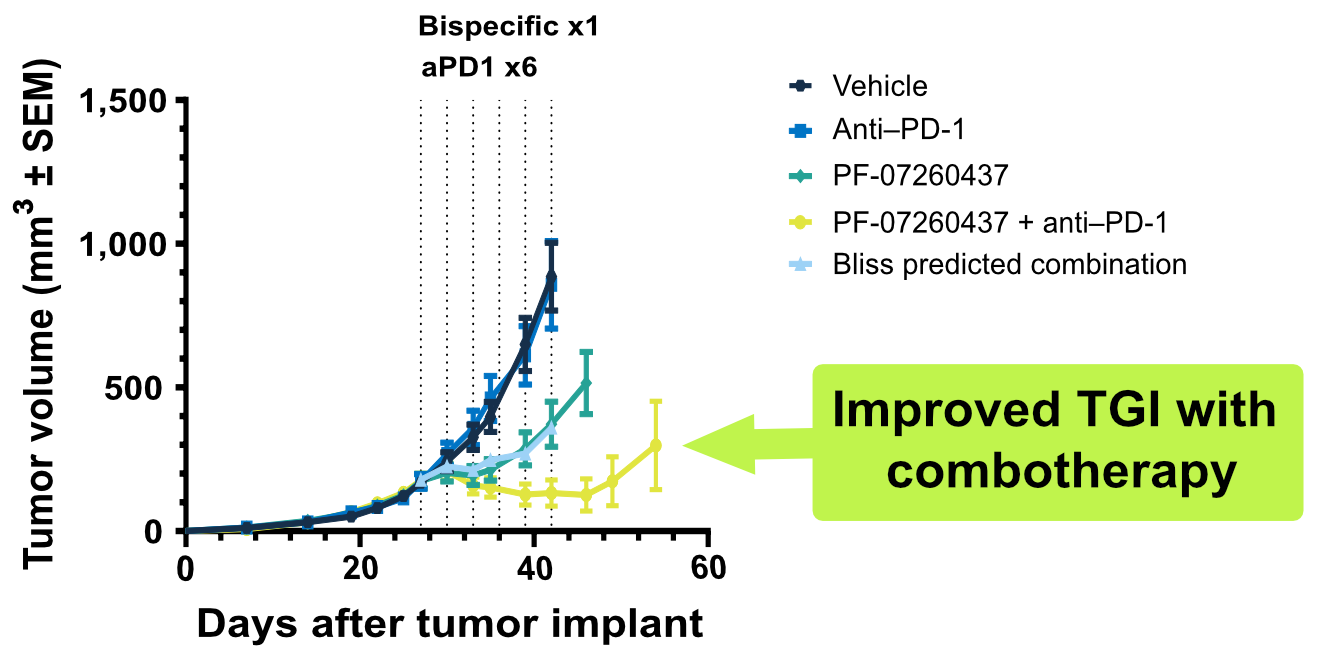
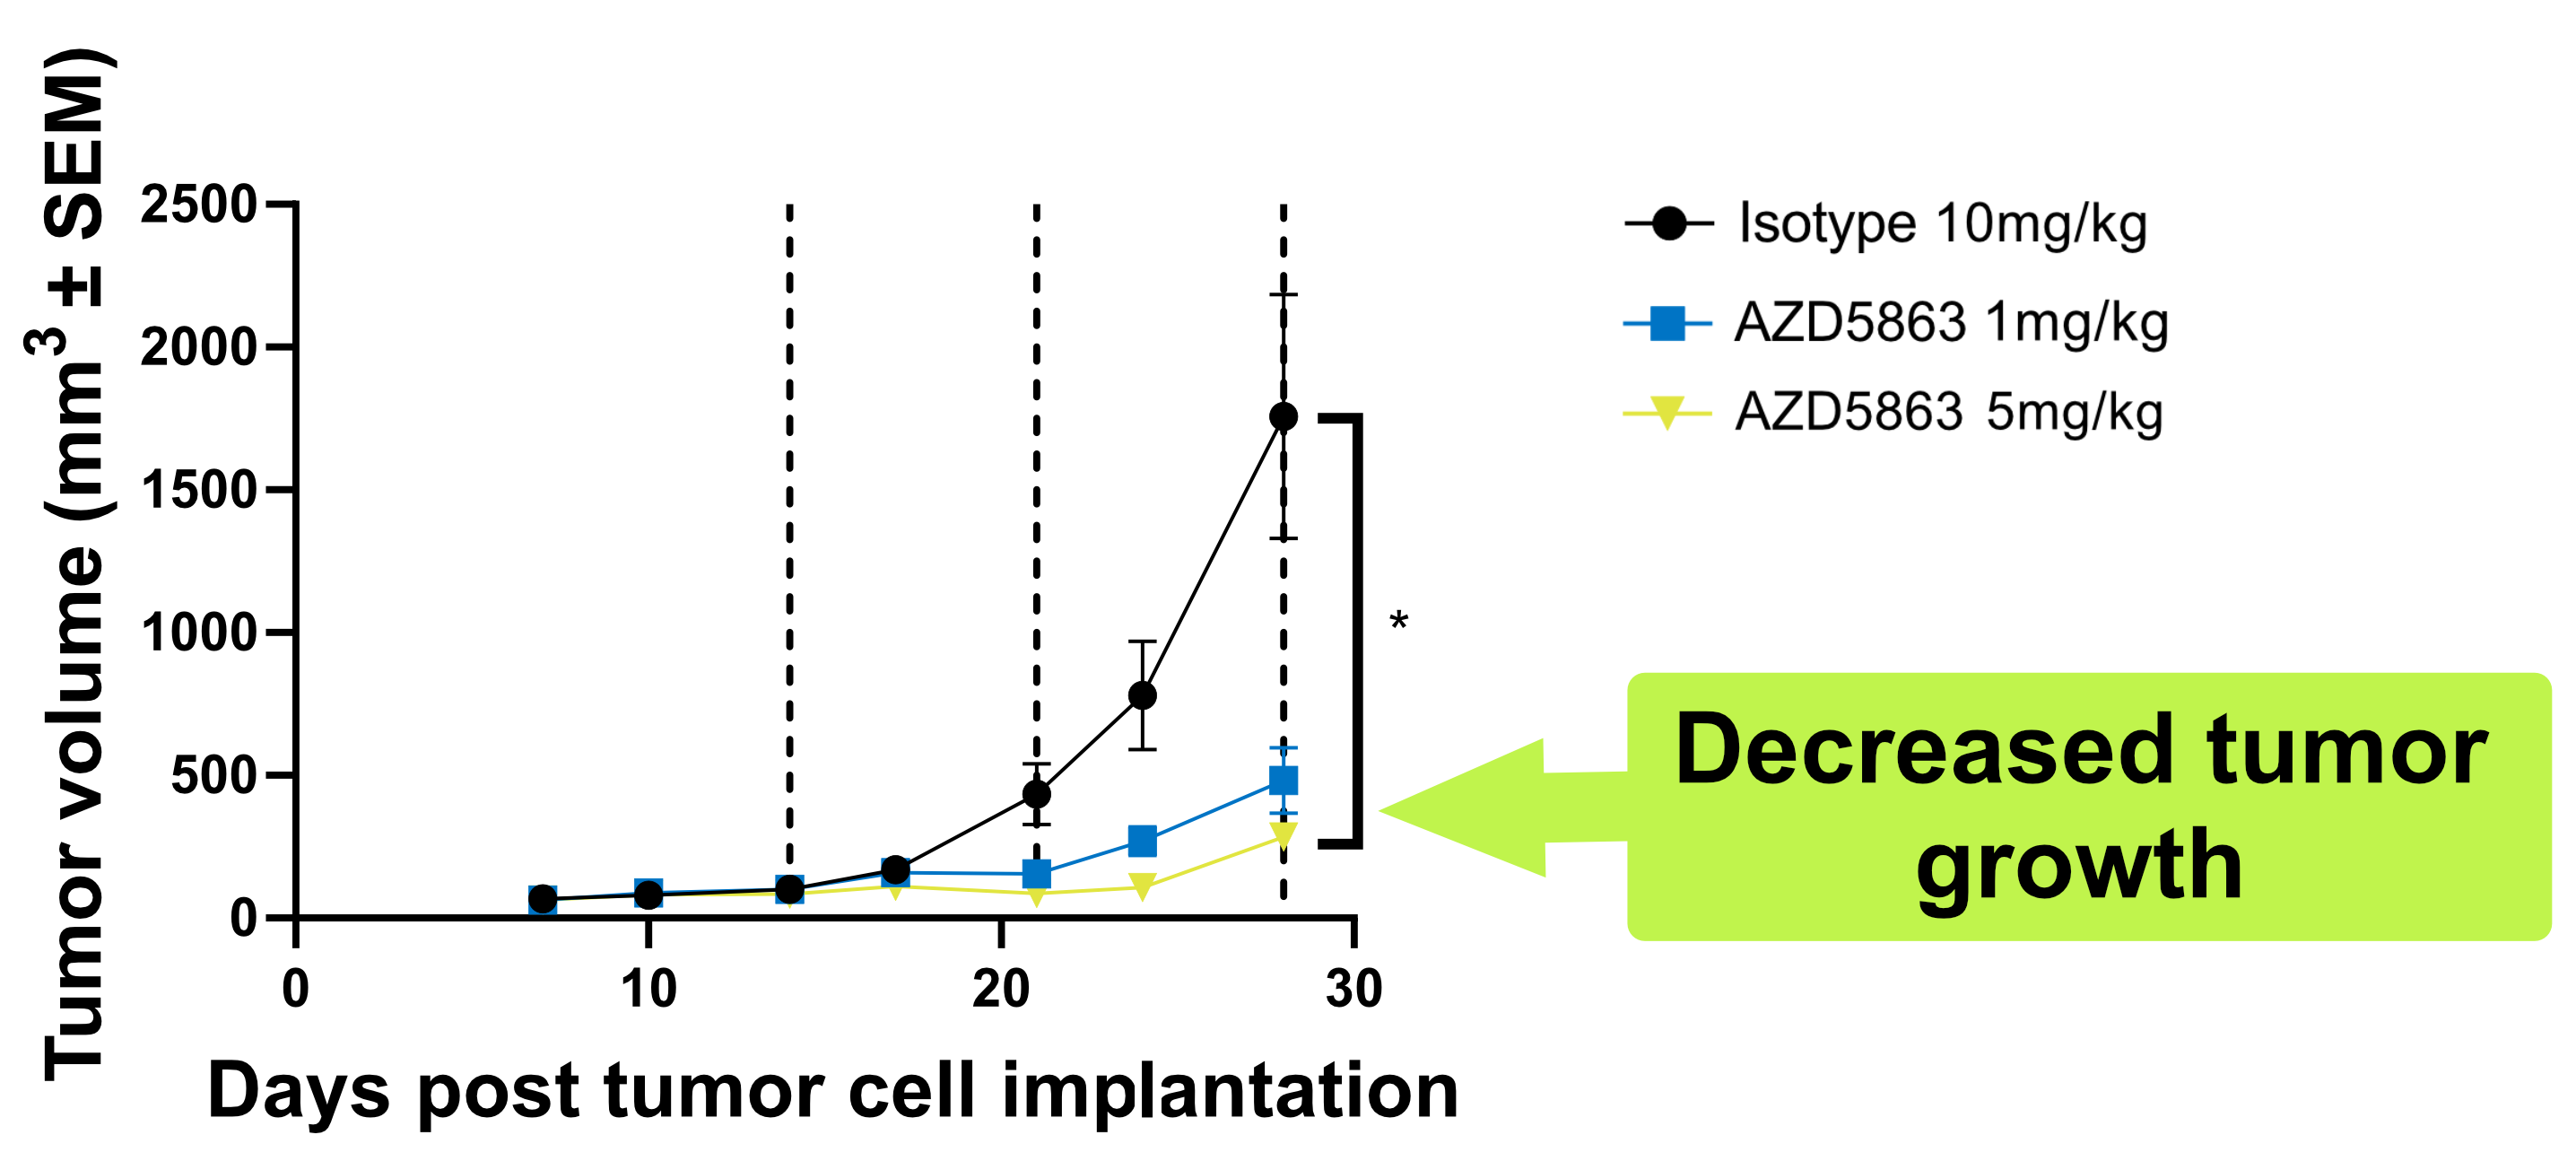
Our hCD3 mouse model portfolio includes options for testing trispecific TCEs, TCEs used in combination with immune checkpoint inhibitors, and TCEs featuring various Fc-engineered regions:

Application Model
Efficacy of bispecific or trispecific antibodies targeting hCD3 and/or hCD28, or of combination therapies genO-panhCD3
genO-hCD3ε
genO-hCD28
genO-panhCD3/hCD28
genO-panhCD3/hCD137 (4-1BB)
genO-panhCD3/hPD-1
genO-panhCD3/hPD-1/hPD-L1
Efficacy of Fc-mediated T-cell engagers genO-panhCD3/hFcγR

Additionally, if you’d like to know more about our model portfolio for TCE assessment, you can find more information here.

hCD28 models:

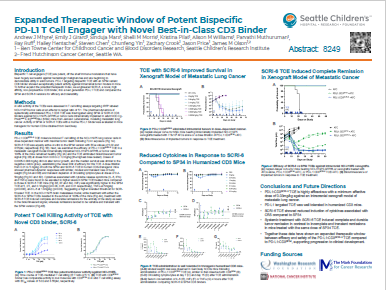
genOway’s hCD28 models (genO-hCD28 and genO-panhCD3/hCD28) allow the evaluation of next‑generation TCEs that rely on CD28 co-stimulation. They display:

  • Physiological regulation and expression pattern of hCD28
  • Expression of different hCD28 isoforms


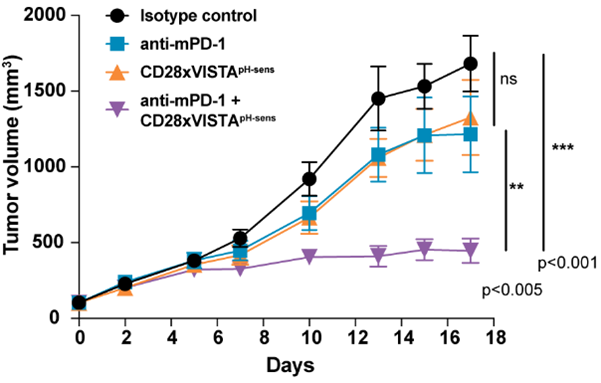
The genO-hCD28 model was validated by Sensei Biotherapeutics, among others, who characterized a tumor-selective bispecific antibody that conditionally co-stimulates T cells via CD28 in a pH- and VISTA-dependent manner:

Graph of tumor volume over time showing strongest tumor growth inhibition with anti‑mPD‑1 combined with CD28xVISTA, compared with isotype control or single treatments, with significance indicated.
Figure 3 – Tumor growth inhibition of MC38 cells expressing VISTA implanted in genO-hCD28 mice. Mice were treated with CD28xVISTA pH sensitive alone or in combination with a murine anti-PD-1. Combination treatment of the TCE awith mPD-1 leads to efficient tumor growth inhibition. Adapted from Thisted et al., 2025.

Cell Line portfolio:

genOway’s catalog of syngeneic cell lines expressing human TAAs or different human immune checkpoints increases the translatability of efficacy studies by ensuring:

  • Co-expression of both TCE targets
  • Direct testing of the clinical TCE (no surrogate required)
  • More realistic human target engagement in vivo

Genetic background Mouse model Compatible cell lines
C57BL/6 genO-panhCD3
genO-hCD28
genO-hCD3ε
genO-panhCD3/hCD28
genO-panhCD3/hCD137 (4-1BB)
genO-panhCD3/hPD-1
genO-panhCD3/hPD-1/hPD-L1
genO-EL4-hCD19-LZ
genO-EL4-hCD20-LZ
genO-MC38-hPD-L1-hHER2-LZ
genO-MC38-mPd-l1KO-hPD-L1-hFAP-LZ
genO-MC38-PD-L1-mPD-L1KO
genO-MC38-hPD-L1-LZ-mPD-L1KO
genO-MC38-PD-L1-LZ
BALB/c genO-panhCD3 genO-CT26-hPD-L1
genO-CT26-hEpCAM-LZ

Furthermore, these cell lines can be customized to your specific needs.

Human Immune System (HIS) mice

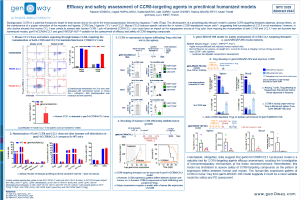
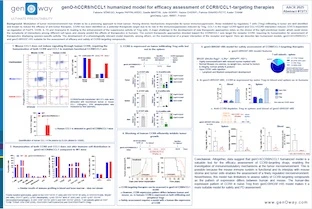
The genO-BRGSF-HIS model is a CD34+ HSC reconstituted mouse with a functional human immune system. It captures key tumor microenvironment features thanks to:

  • Functional human myeloid and lymphoid compartments upon CD34+ HSC-reconstitution
  • Dynamic recruitment and activation profile of immune cells into the TME shaped by tumor cell type and burden
  • Presence of functional γδ T cells

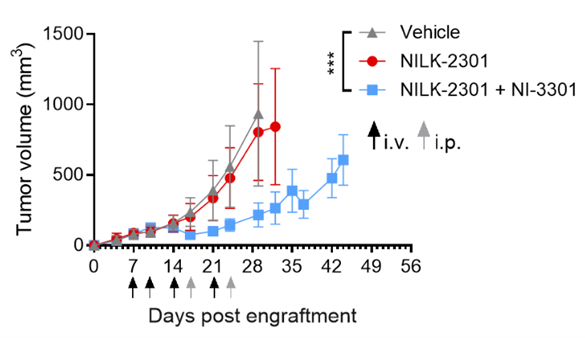
This model recapitulates the tumor-immune dynamics as described in Martin et al., 2025, enabling the translational assessment of TCE efficacy:

Graph of tumor volume over time showing reduced tumor growth with NILK‑2301 plus NI‑3301 compared with vehicle or NILK‑2301 alone, with dosing time points indicated.
Figure 4 – genO-BRGSF-HIS mice were implanted with HPAF-II cells and treated with NILK-2301 and NI-3301, two TCEs that target either CD3 or CD28, respectively, and CEA cell adhesion molecule 5 (CEACAM5). Tumor growth inhibition was followed over time. Treatment with both TCEs leads to efficient tumor growth inhibition. Adapted from Martin et al., 2025.

List of references


Scientific papers:

Webinars

Related resources and publications

Other solutions

Efficacy

Efficacy testing is a critical step in drug development, assessing whether a drug candidate achieves its intended effect at various doses.​

Learn more
Scientific excellence

From model design to experimental results
Featured in 600+ scientific articles

Collaborative approach

Collaboration with 17 Top Pharmas,
170+ Biotechs and 380+ Academic Institutions

Robust validation data on catalog models

Generated with biopharma partners and in-house

Innovative technologies

and guaranteed freedom to operate

Easy access to models

Models with certified health status from professional breeders in US and Europe